How to Measure AI Visibility: The 5-Axis Framework for LLMO Results
“Investing in LLMO is fine — but how would we even know it’s working?” This question comes up every time from the person who has to get the spend approved internally. With SEO you have familiar KPIs — rank, clicks. But your presence inside an AI’s answer can’t be measured with the same ruler.
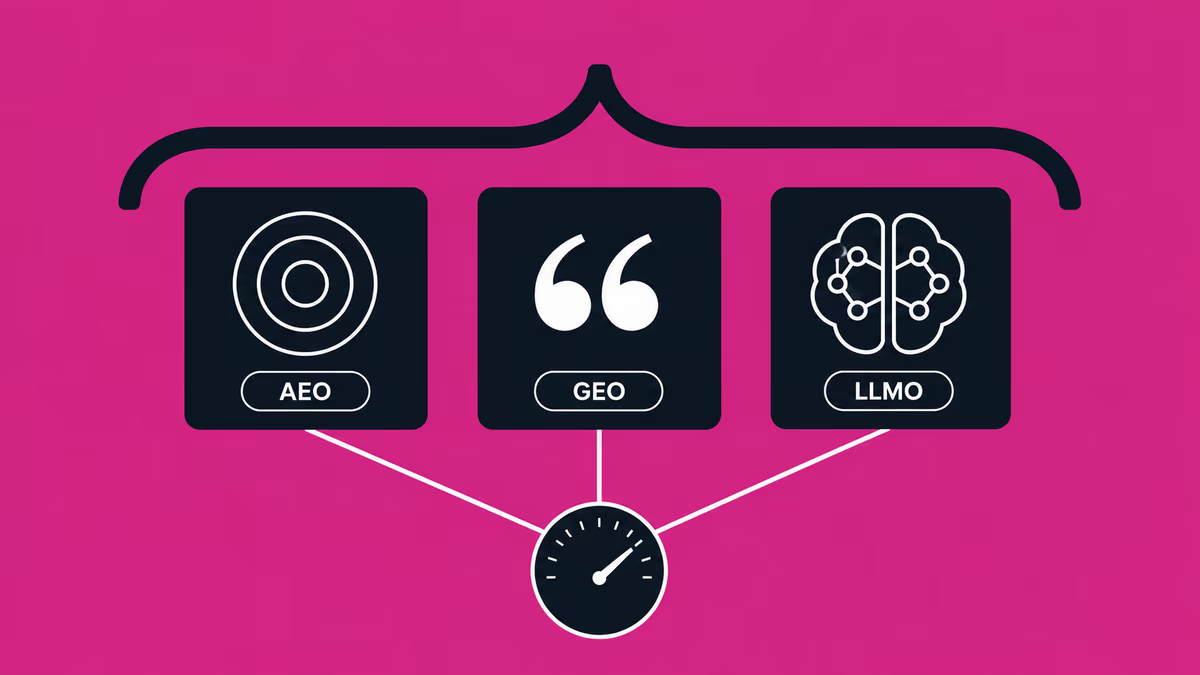
This article covers how to measure the effect of AI search — your AI visibility — using the five axes we build our monthly reports around. Why SEO KPIs don’t transfer, how the core metric (share of voice) is defined, how to build a prompt panel, and what a good report should contain. For the terminology (how AEO, GEO and LLMO differ), see our AIO glossary.
The short answer: measure share of voice inside AI answers
Up front: the north-star metric for AI search is how often your brand is mentioned or recommended inside AI answers, across a fixed set of questions (a prompt panel) — that is, share of voice. It isn’t a single number like a search rank; it’s a picture, tracked continuously across several axes: which engine, versus which competitors, in what tone.
And the buyer’s decision rule is simple: a vendor who can’t show you monthly, per-engine share of voice against named competitors is selling activity, not outcomes. Here’s the reasoning, step by step.
Why SEO KPIs don’t transfer
Traditional SEO measured success by rank, click-through rate (CTR) and traffic. In AI search, those premises break.
- “Rank” means something different — the AI doesn’t line up ten blue links; it synthesizes one answer. There’s no “position 1,” only “were you mentioned, and in what context were you recommended.”
- There’s no click — users often finish deciding inside the AI’s answer, before they ever reach your site (zero-click). CTR and traffic can’t capture this invisible influence.
- Engines disagree — ChatGPT, Claude, Gemini and Google AI Overviews return different answers to the same question. There is no single ranking table.
So you need a new ruler — measuring “AI visibility,” taken against the AI’s answers themselves.
The 5 axes of AI visibility
We measure AI answers along five axes. This is the long-form version of the framework shown in the Method section of our AIO page. For each axis: what it measures, what “bad” looks like, and what action it triggers.
1. Visibility (share of voice)
What it measures — the share of your prompt panel in which your brand is mentioned in the AI’s answer. The single most important north-star metric. What “bad” looks like — low mention rate on key questions (competitors appear, you don’t). The action it triggers — grow primary information, fix structure, build external mentions. The specifics are in The Complete LLMO Playbook.
2. Rank
What it measures — when you are mentioned, your average position within the answer (how far down you’re introduced). What “bad” looks like — you’re mentioned, but always after competitors. The action it triggers — strengthen the reasons to recommend you (track record, expertise, third-party validation).
3. Sentiment
What it measures — the tone of the mention: positive, neutral or negative. What “bad” looks like — you’re described negatively or inaccurately, off stale or wrong information. The action it triggers — keep official information current and correct external misinformation.
4. Competitors
What it measures — which competitors appear in the same answer, and each one’s share of voice. What “bad” looks like — one competitor is recommended ahead of you on every question. The action it triggers — root-cause analysis of why that competitor is recommended (its sources, its strengths), and sharper differentiation.
5. Sources (citations)
What it measures — the sources the AI cited for its answer: your own site, or third-party media. What “bad” looks like — you aren’t cited; aggregators and competitor-leaning sources dominate. The action it triggers — design primary information that’s easy to cite, and build third-party mentions.
Tracked across the four major engines × your prompt panel every month, these five axes turn “we’re vaguely not showing up in AI” into data on where you win and where you lose.
How to build a prompt panel
The foundation of measurement is what you ask — the prompt panel. Three things matter.
- Design it as topics × buyer questions — “Which do you recommend for [category]?”, “What’s [your brand]‘s reputation?”, “How do you compare to [competitor]?”, “How do I solve [problem]?” — map the questions your customers actually put to AI.
- Aim for 50–100 prompts — too few and you’re at the mercy of a single run. You need enough volume before a “percentage” means anything.
- Measure per engine, on a cadence — each engine answers differently, so you measure across multiple engines on a regular cadence such as weekly.
- Sample each prompt several times per check — beyond that, the same engine returns different answers to the same question on each run. Running each prompt 3–10 times per cycle and averaging gives you a reproducible number instead of one lucky (or unlucky) draw. It’s not enough to smooth out the cross-engine difference; you also have to smooth the run-to-run wobble within a single engine — that’s the condition for an objective visibility number. A quick check that reports a single run can’t do this.
Build the panel once and it becomes an asset — measuring the same question set every month is exactly what lets you track change.
What a monthly report should contain
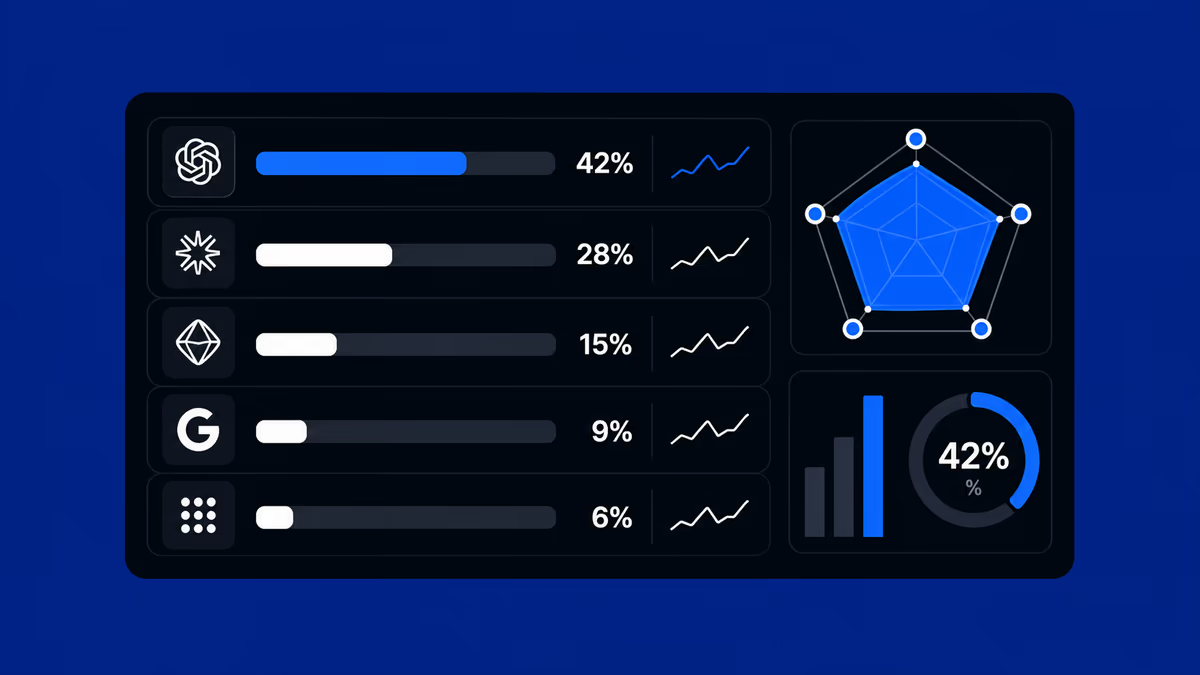
A good report isn’t a pile of screenshots. It should lay out the five axes per prompt and per engine, in a form you can compare against competitors. Something like this (figures illustrative; three of the five axes excerpted here — a real report also carries the Competitors and Sources axes):
| Engine | Visibility | Sentiment | Rank |
|---|---|---|---|
| Overall | 67% (8/12) | +0.6 | #2.3 |
| ChatGPT | 100% (3/3) | +0.8 | #1.7 |
| Claude | 67% (2/3) | +0.6 | #2.3 |
| Gemini | 33% (1/3) | +0.4 | #3.3 |
| AI Overviews | 67% (2/3) | +0.5 | #2.0 |
Illustrative data — in practice each prompt is scanned across the major engines on a cadence and shown against competitors.
From this example you can see the action at a glance: “visibility is weak on Gemini (33%),” “overall we’re second, behind one competitor.” When each number carries a note on why it moved, the report becomes something you can decide on.
Measurement itself is automatable — and the repeated sampling above (running each prompt many times and averaging) is impractical by hand, which makes it a job for a platform. We use one we co-develop, Supasaito, behind our monthly reports, sampling each prompt multiple times to stabilize the numbers. But a tool gives you the numbers only — translating those numbers into competitive strategy, and deciding what to fix first, is human work.
Our free AI Visibility Audit and the monthly report in our AIO Program are exactly this five-axis report — but they do not cover the same ground. The free audit is a single measurement across two engines, ChatGPT and Google AI Overviews, and carries no trend. The AIO Program’s monthly report widens the engines and follows the movement month to month. Both hand you your share of voice versus competitors — plus the interpretation and the improvement instructions.
What to run that measurement with is a separate question. Nine AI-visibility tools, compared on 14 points, are here. It is written by one of the nine, which that piece discloses in its opening paragraph.
Get your free AI visibility audit →
Common measurement mistakes
Finally, three traps to avoid.
- Don’t judge on single-prompt anecdotes — “I asked once and we showed up / didn’t” isn’t measurement. Answers wobble, so you have to read them as a percentage.
- Don’t cherry-pick flattering screenshots — clipping only the wins misreads reality. With a fixed panel, count the misses as well as the hits.
- Don’t measure after every tweak — AI takes time to reflect changes; measuring after each one reads noise as results. Look on a fixed cadence, monthly or so.
Measurement isn’t only for proving results. It’s the compass for deciding what to fix next — which is why building a setup where numbers and interpretation arrive together is the surest way to keep LLMO moving.
FAQ
What is AI visibility?
It’s a metric for how often your brand is mentioned or recommended inside AI answers, across a fixed set of questions (a prompt panel). The core number is “share of voice” — the share of the AI’s answers you occupy versus competitors. Think of it as the north-star metric that replaces search rank in the AI-search era.
How often should we measure?
Weekly measurement with a monthly review is the practical guide. AI answers wobble run to run, so run each prompt several times per check (3–10 is a good guide), average them, and take counts weekly to improve accuracy. Meanwhile, changes take time to propagate (1–3 months for the fastest surfaces, 3–6 months for meaningful share-of-voice change), so judge results on a monthly-or-longer cadence. The key is not to celebrate or panic after every single tweak.
Is there a free way to measure AI visibility?
Yes. Ask ChatGPT and Gemini several questions about your brand and competitors and record, by hand, whether you’re mentioned, your rank, the tone and the cited sources — you can gauge where you stand for free (here’s the self-check walkthrough). For the machine-readability side, PageSpeed Insights now scores it for free too (our Agentic Browsing guide). But doing it manually gets expensive fast as you add prompts, and it’s hard to average out per-engine wobble. At the scale of dozens of prompts × multiple engines × ongoing, a measurement platform or outside help becomes the realistic option.
How should we judge a vendor’s report?
On four points: (1) is it broken out per engine, (2) does it compare against named competitors, (3) is it continuous rather than a one-off, and (4) does each number carry an interpretation of why it moved. A report that lacks these and just lines up pretty screenshots may be a record of activity, not outcomes. We cover the criteria further in our LLMO agency comparison.